From Digital Warehouse to $3,000 Drop: The Robert Mars Transformation.
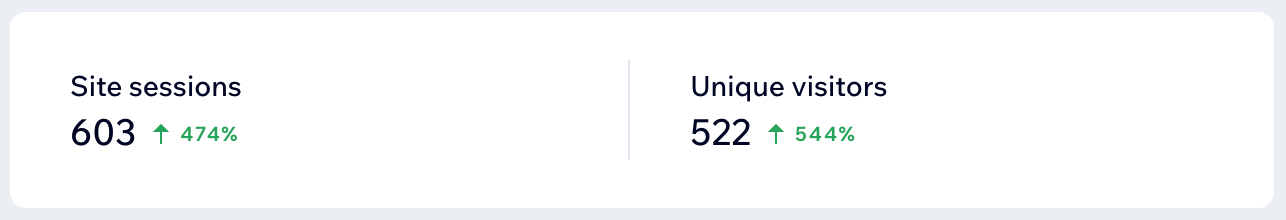
See how a 12-day curated release strategy drove a 474% spike in traffic and sold out limited edition prints.
Total Page Views:
937
Unique Visitors:
299
Launch Day Peak:
365 Page Views
The Challenge
Breaking the Cycle of Stagnation
Robert’s previous site had become a digital warehouse. With years of old prints sitting in inventory, traffic was "always on" but rarely converted. The brand felt static rather than exclusive.
The Strategy
The "Digital Purge" & The Hype Cycle
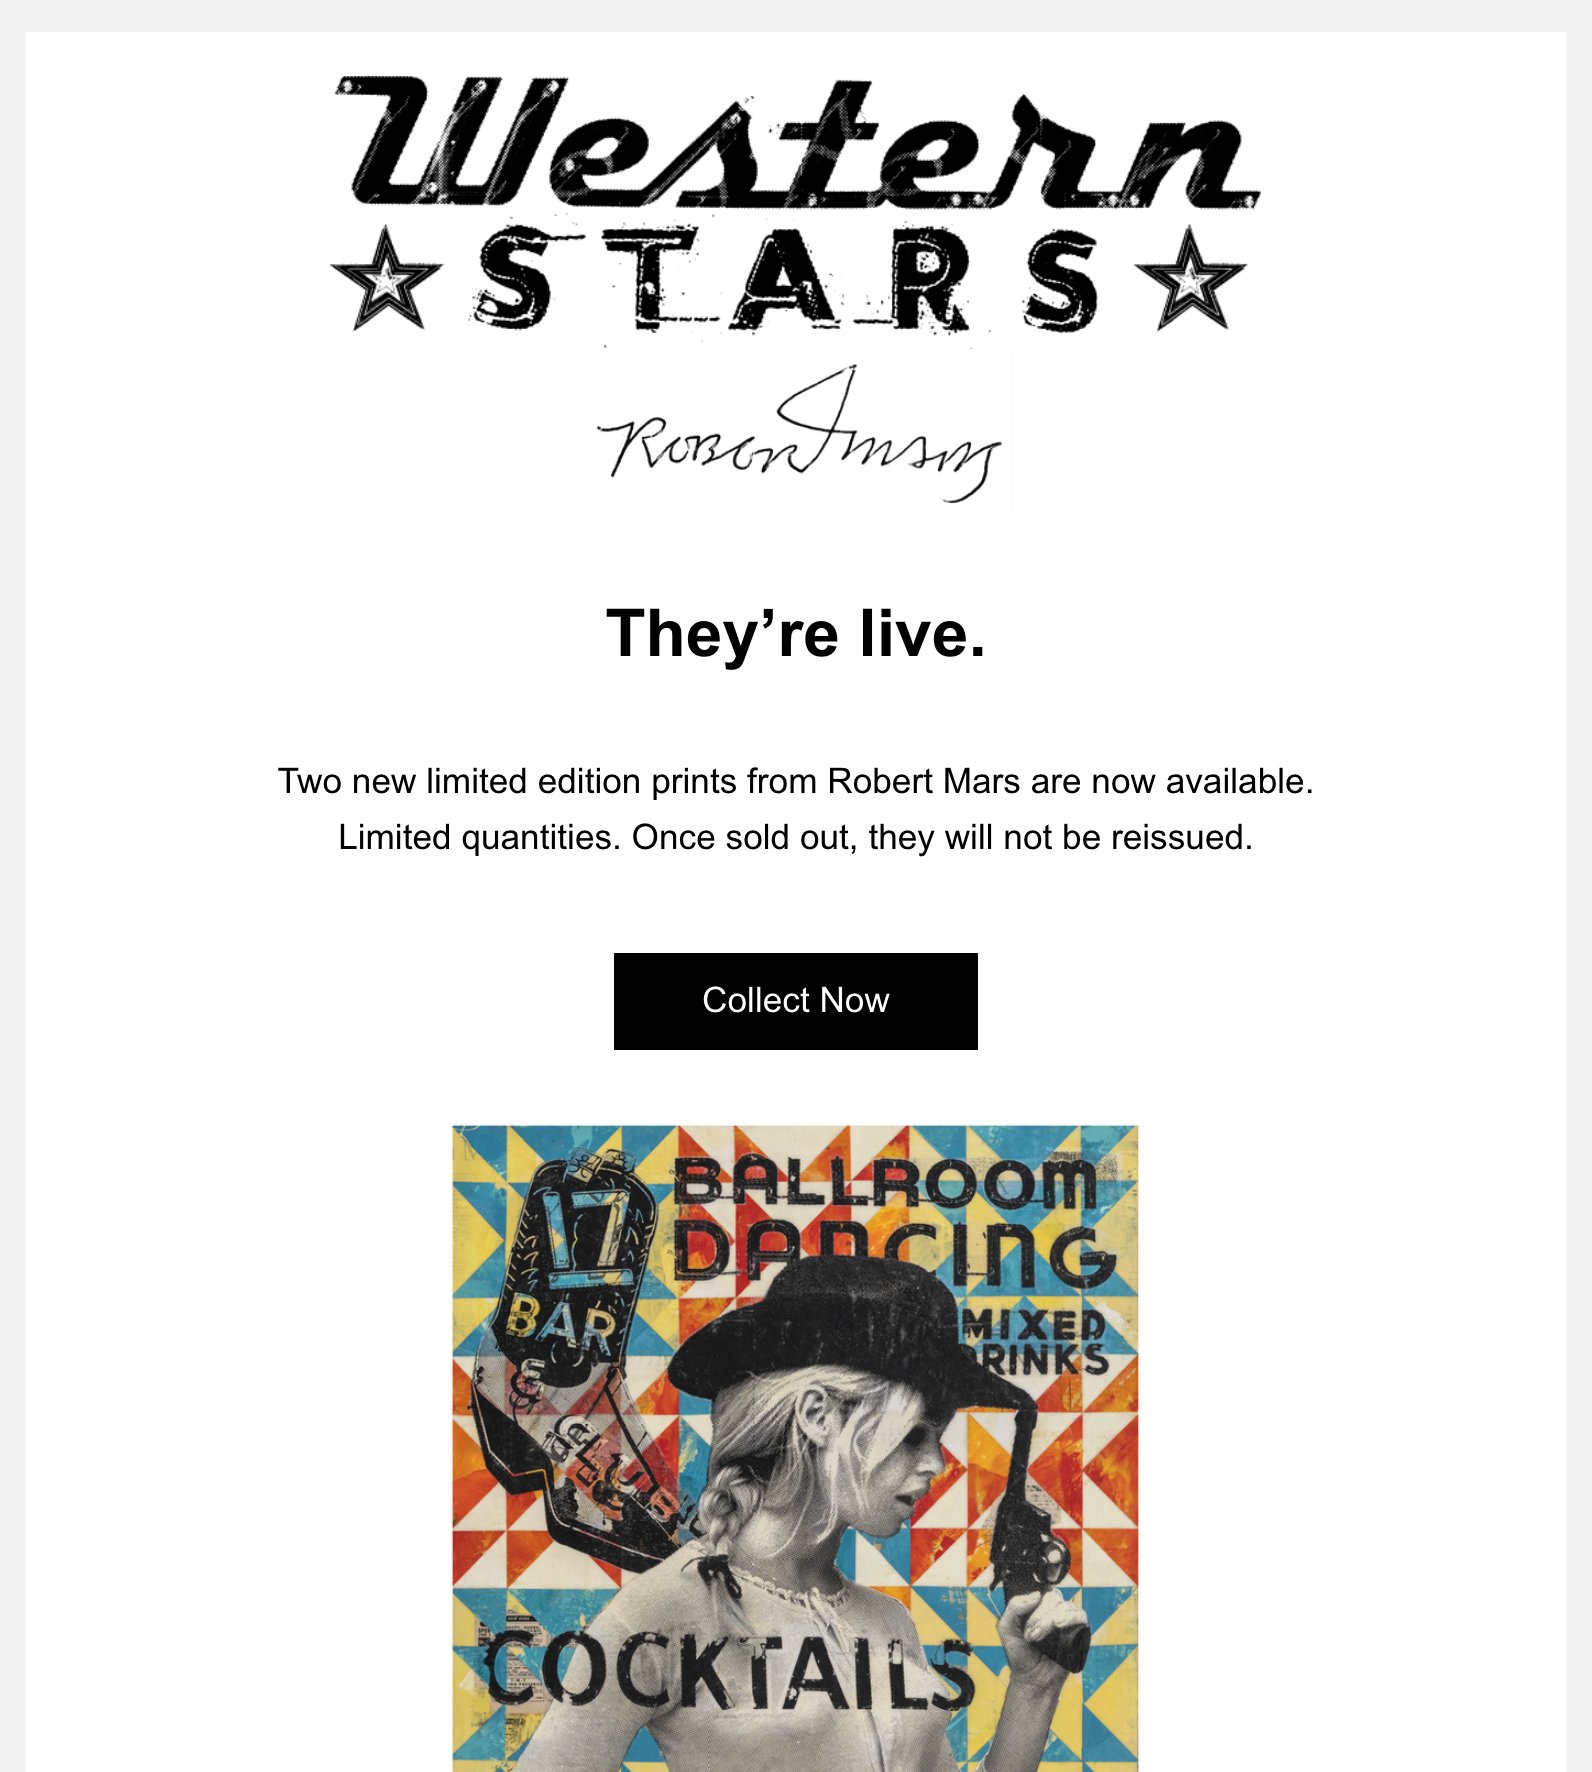
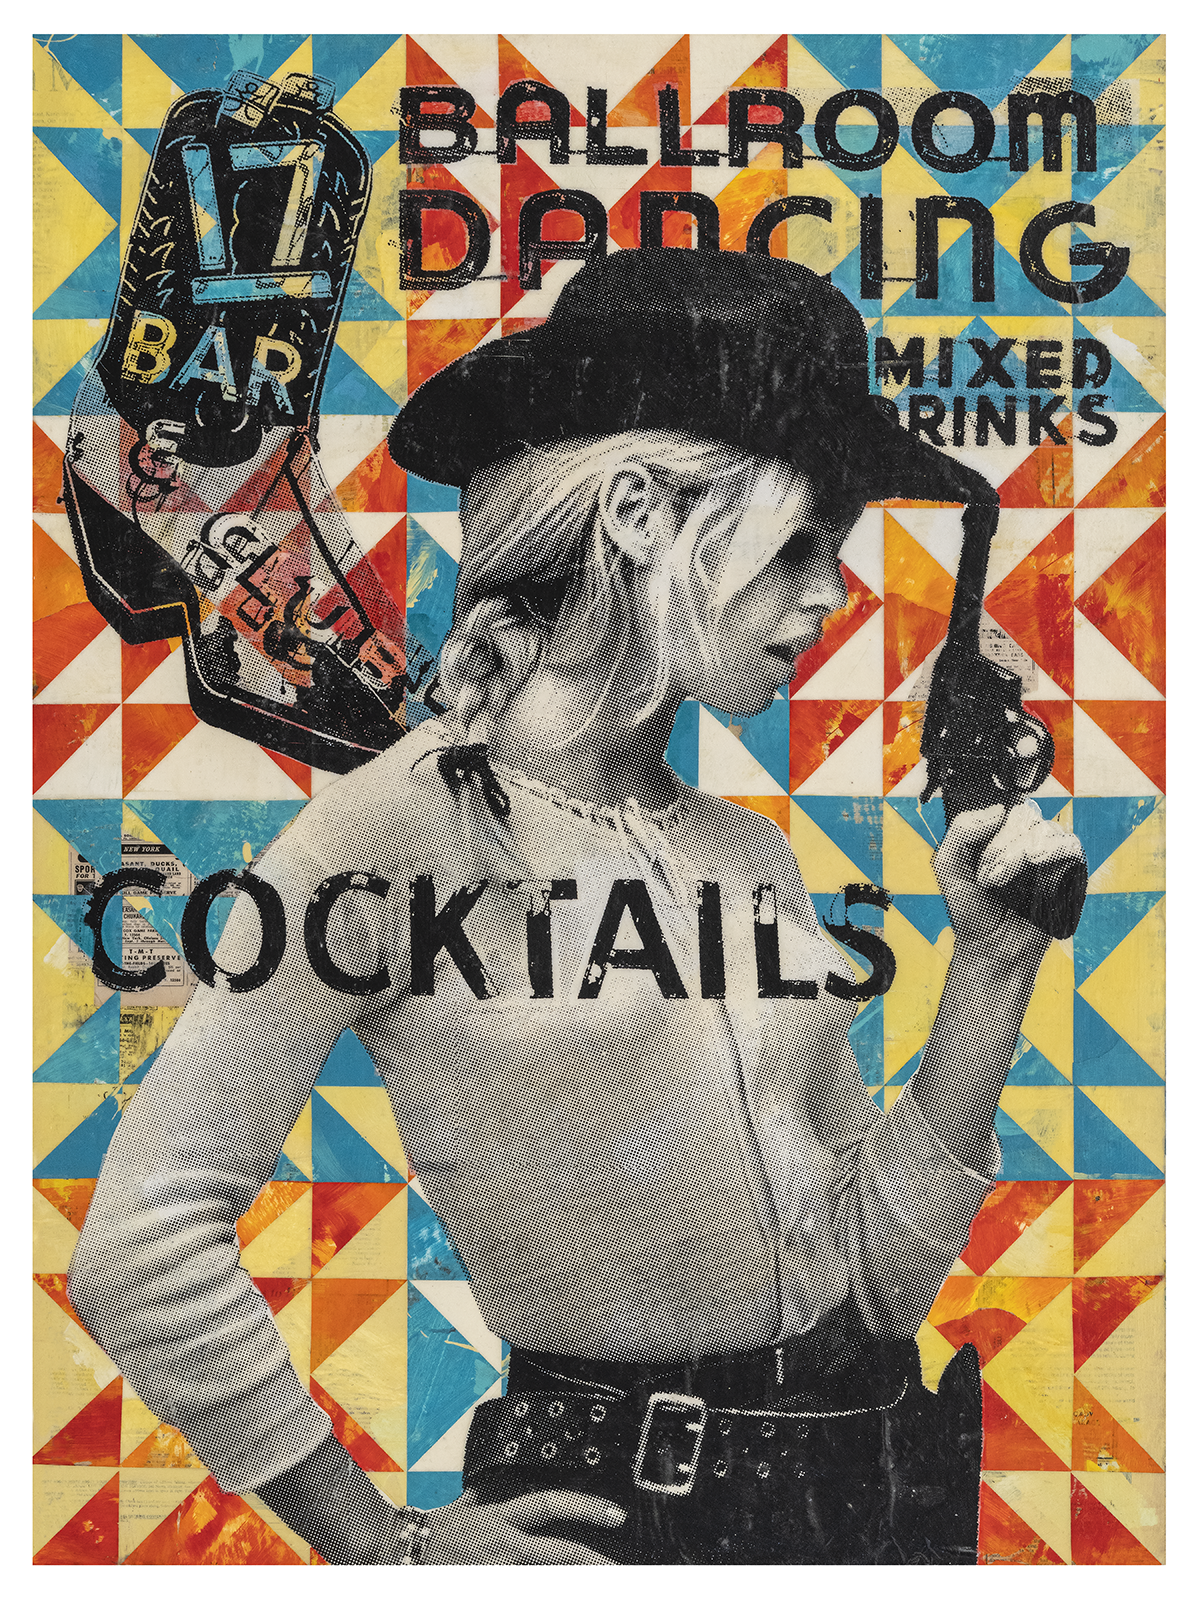
We worked with Robert to pull all existing prints from the site. We shifted the focus to a 14-day hype cycle for just two specific pieces: “Two To Tango” and “Cutting Teeth.” By creating a definitive start and end date, we turned a "visit" into an "event."
The Scarcity Playbook
How We Fueled the Buzz
Shifting to a scarcity-based model means moving away from a traditional "always-on" e-commerce shop where items sit indefinitely. Instead, we treated the print release like an exclusive event—creating an artificial shortage of time and volume. To turn this exclusivity into actual traffic and $3,000+ in revenue, we executed a dual-channel marketing strategy over a 12-day window:
Hyper-Targeted Email Sequences (Leveraging the Studio List)
Rather than sending a single announcement email, we nurtured Robert’s existing collectors through a high-intent, multi-stage email campaign:
- The Hype Phase: Teaser emails sent days before the release to build anticipation, preview the artwork (“Two To Tango” and “Cutting Teeth”), and establish the exact date and time of the drop.
- The Release Drop: A high-impact, direct-to-shop email launched the exact minute the countdown timer hit zero, driving immediate, competitive traffic to the site.
- The Follow-Up: Strategic "last chance" emails sent to clean up remaining inventory before the window closed, creating an urgent fear of missing out (FOMO).
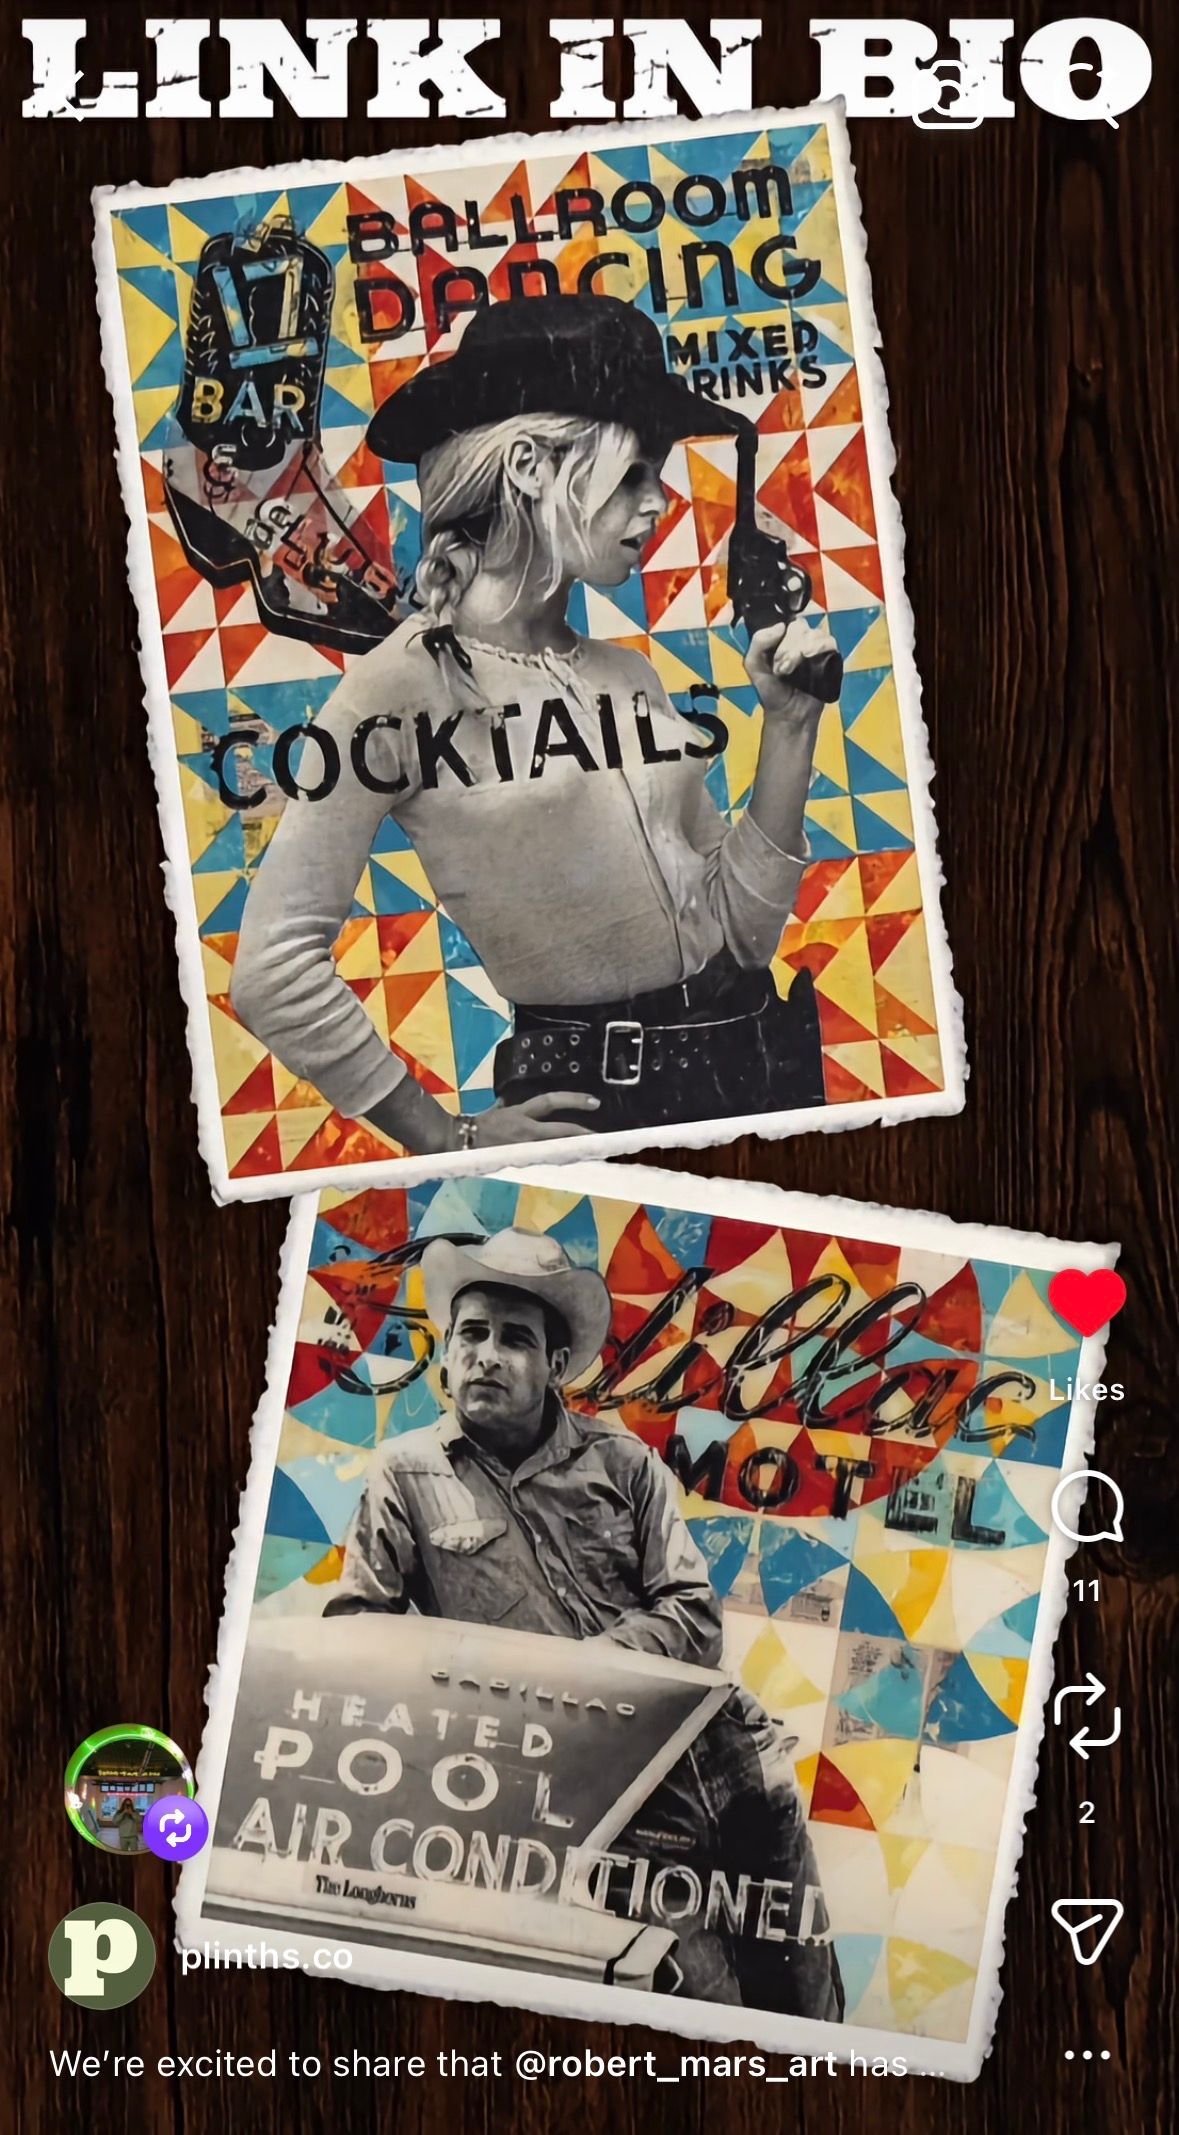
Social Leverage & Amplified Reach (Instagram Strategy)
To capture new eyes and re-engage his core social community, we leveraged Robert’s organic Instagram presence and paired it with targeted spend:
- Organic Anticipation: Coordinated Instagram grid posts and stories counted down to the drop, turning his followers into an active waiting list.
- The Launch-Day Boost: On the morning of the release, we strategically boosted a top-performing launch post. This injected paid ad fuel directly into a warm audience right when purchasing intent was at its absolute highest.
The Data
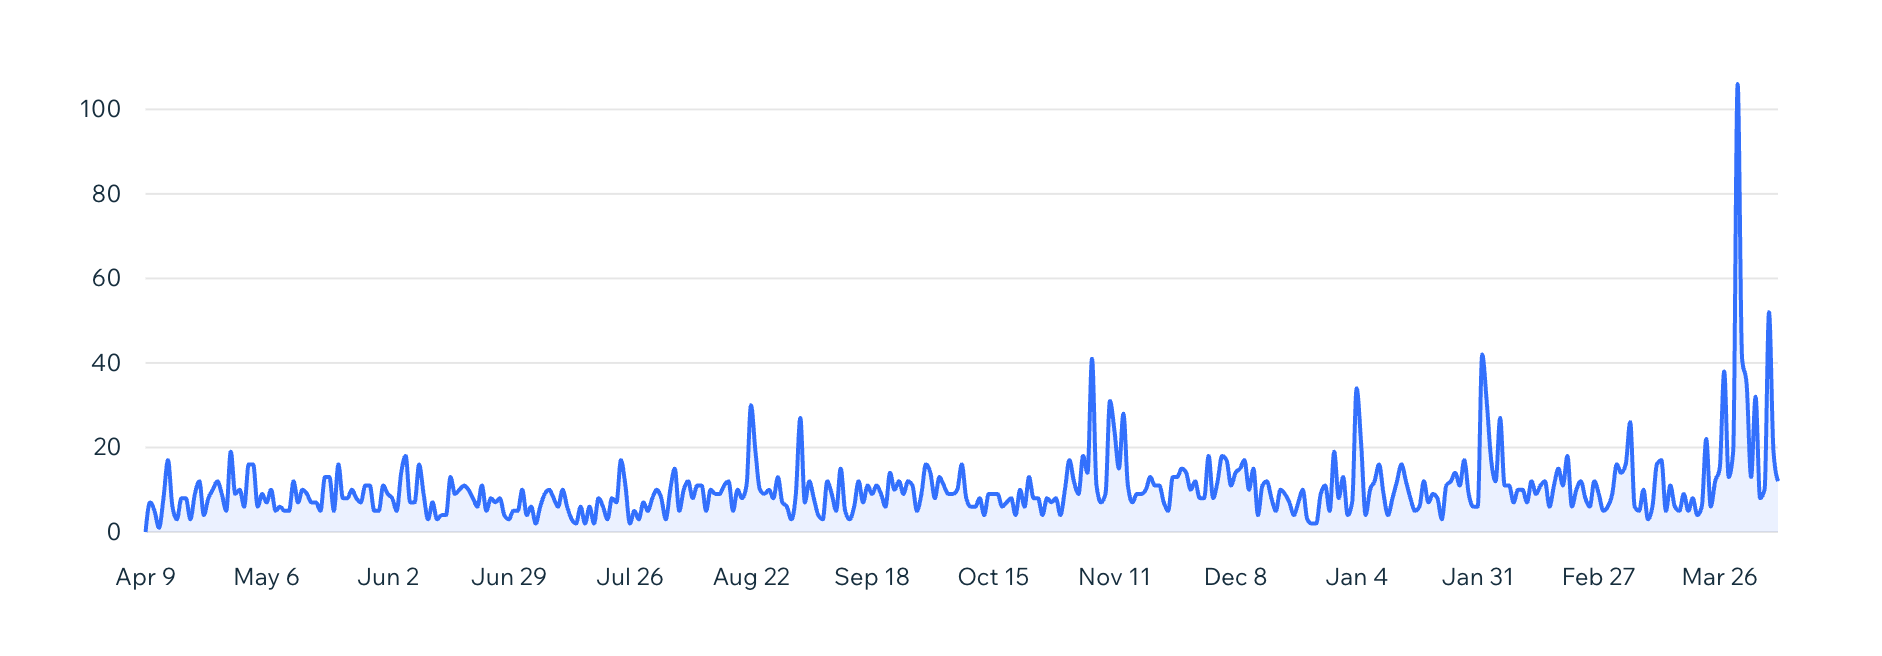
12 Days. 1,000 Views.
By concentrating traffic into a highly coordinated window via Instagram and email, we achieved more engagement in 12 days than the previous 3 months combined.
Launch Day Focus: Driven by the simultaneous drop email and boosted Instagram post, March 30th saw a massive vertical spike of 125+ sessions and 365 page views in a single 24-hour window, proving that scarcity-based marketing combined with multi-channel promotion drives immediate action.
Retention: Visitors spent an average of 2m 19s on site—nearly double the industry average for artist portfolios.
The Method
Curation over Volume. By removing the 'noise' of old inventory, we allowed Robert's newest work to take center stage, resulting in his most successful digital release to date.
Ready to see these results for your own studio?